Notice that this line is going in an upward direction! (Reading from left to right)
This means that this is a positive slope.
Notice that this line is going in an downward direction! (Reading from left to right)
This means that this is a negative slope.
The slope of a line measures the steepness of the line. This is also called rate of change.
Most of you are probably familiar with associating slope with "rise over
run".
Rise means how many units you move up or down from point to point. On the
graph that would be a change in the y values.
Run means how far left or right you move from point to point. On the graph, that would mean a change of x values.
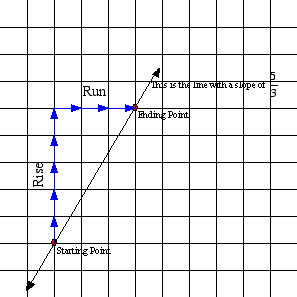
Example 1: A slope of 5/3 means that from your starting point, you will rise 5 units (up) and run 3 units (right) to get to the next point. Once you have these two points, you can draw the line that goes through these two points.
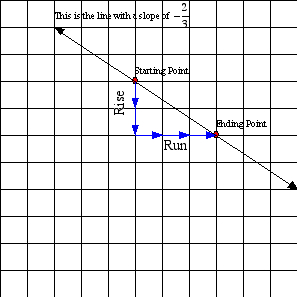
Example 2: A slope of -2/3 means that from your starting point, will rise - 2 units (down) and run 3 units (right) to get to the next point. Once you have these two points, you can draw the line that goes through these two points.
There are two other slopes that are not included. A slope of 0 means 0/1 which is no rise, just run; therefore, this is a horizontal line. A slope of undefined happens when the ratio 1/0 is formed. This number cannot be calulated, but means rise 1 and do not run. This becomes a vertical line.
Assignment:
Use graph paper to draw the following slopes: (make your own starting point for each)